SIF Report
Characterizing Post-Hurricane Coastal Change: Bathymetry in Galveston Bay along the Bolivar Peninsula using LiDAR and Hyperspectral imageryPrincipal Investigator: Cynthia Evans/KT
Co-Investigator(s): William Stefanov/KX; Ramesh Shrestha, University of Houston, Cullen
College of Engineering and National Center for Airborne Laser Mapping (NCALM)
Project Overview
The primary goal of this project was to collect airborne blue-green LiDAR and hyperspectral visible to near infrared data over a small area on the Bolivar Peninsula between Galveston Bay and the Gulf of Mexico to test the LiDAR effectiveness in the turbid waters of Galveston Bay, and to create a baseline map that can be used to monitor future coastal change. Blue-green LiDAR has been used to map bathymetry in shallow, clear water coastal environments [Fernandez-Diaz, et al, 2014]. NASA and University of Houston NCALM scientists wanted to test the feasibility of mapping Gulf coastal waters with elevated turbidity. The location of the field study is centered on Rollover Pass, a region that has experienced high rates of erosion because of coastal dynamics that include decreasing offshore sediment supply [eg. Anderson, 2007; Watson, 1999], persistent southwestern longshore transport, and coastal development such as the placement of the Rollover Pass channel cutting through the peninsula to the eastern arm of Galveston Bay [e.g., Morton, 1975, Watson, 1999; Texas General Land Office, 2008a]. In addition, this area experienced some of the largest storm surges (~6m) from Hurricane Ike in 2008, resulting in remarkable beach scouring and sediment deposition on the bay side of the peninsula [e.g., Kraus and Lin, 2009; Watson, 2009; National Weather Service Houston/Galveston 2008; Doran et al, 2009; see Figure 1]. Earlier field work conducted in 2011-12 documented the composition of the Hurricane Ike deposits [Evans, et al, 2011].
Secondary goals of the project were to gain experience working with LiDAR data, from collection through data processing, explore the potential of these data sets for application to NASA Climate Adaptation Science Investigator Workgroup activities at Johnson Space Center (JSC), and build collaborations and ideas for new projects with the University of Houston NCALM group.
Methods
Field Data Collection
Originally, we had planned for data collection in the spring (MarchApril) of 2013 to increase probability for better atmospheric clarity (important for hyperspectral data collection), and to have a better chance of avoiding factors that contribute to water turbidity (high winds and warm temperatures that foster algae growth). However, flight schedules and weather delayed our data collection. The first set of data was collected 19 June 2013. Our University of Houston NCALM partners flew their Cessna 337 Twin Engine Aircraft equipped with a 70 kHz AQUARIUS Green Laser sensor head for bathymetry (vertical accuracy: 5 ‐ 10 cm, point density: 5 ‐ 10 per square meter,) and a CASI 1500 Hyperspectral Spectrometer. Figure 2 shows the site boxes for the aerial transects. We also deployed some buoys in the field area and collected a small set of field measurements (water depth and turbidity) in conjunction with the aerial data collection. The atmospheric conditions were not ideal in June, and the NCALM team flew the transects again in July. We did not support the July airborne deployment with field ground truth.
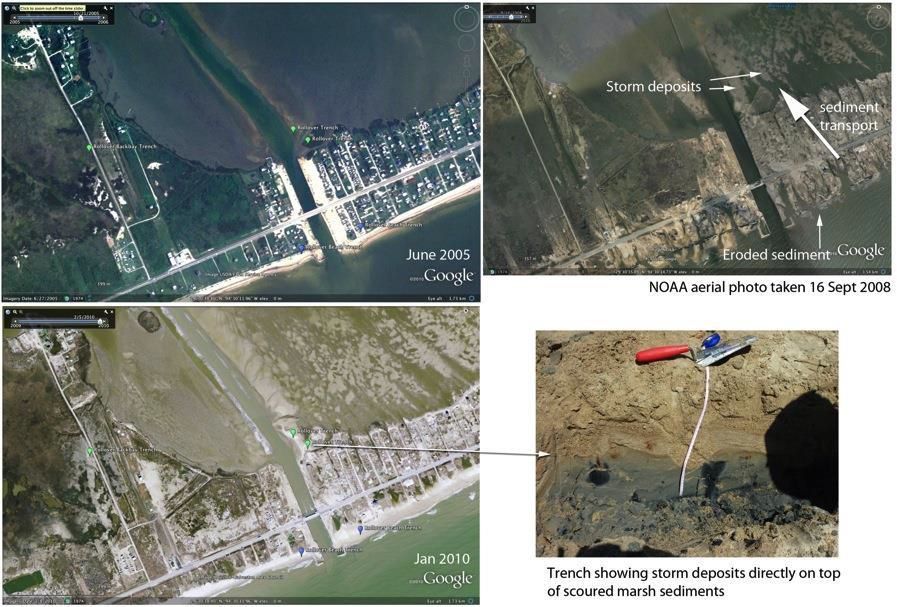
Figure 1. Rollover Pass on the Bolivar Peninsula, before and after Hurricane Ike, showing storm surge deposits. Green pins (left images) show locations of sediment samples and cores. The top right image was taken 3 days after the storm and shows the sediment pathway as it eroded from the beach and transported and deposited in the bay. Lower right image shows the hurricane deposits on top of former marsh sediments exposed in a trench (arrow shows trench location).
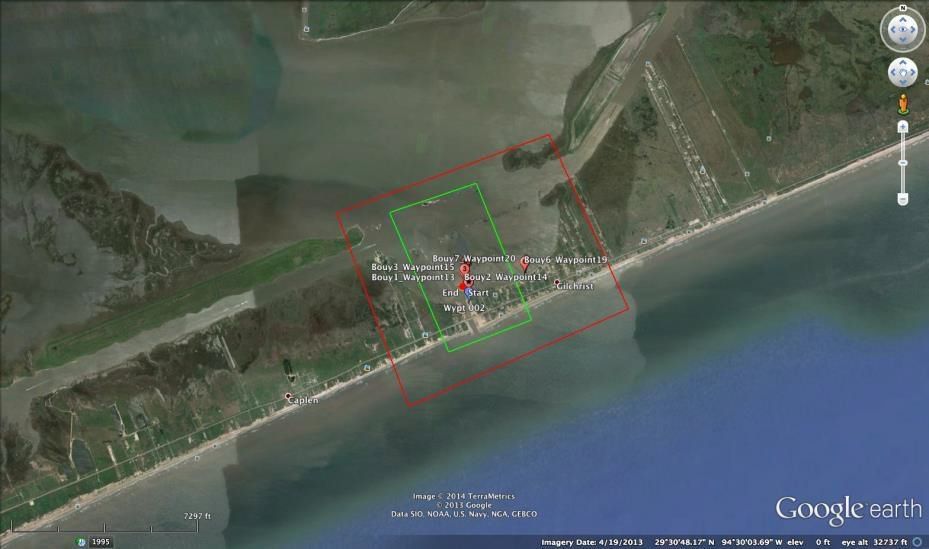
Figure 2. Transect boundaries (approximate) for aerial data collection. Buoy locations are marked with red pins.
Our June airborne and field deployment included:
- Flight plan discussion with NCALM, and real time go/no go discussions in the field based on local cloud build-up.
- Roughly 4 hours of flight data (areas defined in figure 2), including LiDAR passes, and 6 orthogonal altitude transects for hyperspectral data collection at different spatial and spectral resolutions. The flight plan included a set of passes of 1.2-1.5 m hyperspectral data with 72 bands (10nm spectral resolution); another set to collect 1 m/48 band hyperspectral data (14nm spatial resolution), and a final high spatial resolution pass (0.5-0.6m, 16 band with 42 nm spectral resolution), together with a ~ 3 hour Green LiDAR collection.
- Buoy deployment, water depth measurements and water turbidity assessments. 7 buoys were placed within the field area to mark locations for turbidity and water depth measurements (Table 1; Figs. 4 and 5). The buoys were placed in a tidal channel (buoy 2, 100 cm depth), shoals of 10-30 cm interpreted as hurricane overwash deposits (buoys 1, 3, and 4), a small oyster reef (buoy 5) and alongside a channel running parallel to the coastline (buoys 6 and 7).
- Collection of NOAA buoy real time tide and water temperature data (Figure 3).
During the field deployment (roughly 10:30 CDT to 13:30 CDT), the tide phase resulted in water levels dropping between 10-15 cm (see Table 1 and Figure 3). Water clarity, measured using a secchi disc, was variable, but no better than 30 cm.
Rollover Pass- June 19 2013 Data
| Item | Bouy 1 | Bouy 2 | Bouy 3 | Bouy 4 | Bouy 5 | Bouy 6 | Bouy 7 |
|---|---|---|---|---|---|---|---|
| Latitude (DMS, north) | 29º 30' 44" | 29º 30' 44" | 29º 30' 45" | 29º 30' 48" | 29º 30' 48" | 29º 30' 48" | 29º 30' 49" |
| Longitude (DMS, west) | 94º 30' 03" | 94º 30' 04" | 94º 30' 04" | 94º 30' 03" | 94º 30' 02" | 94º 29' 36" | 94º 29' 35" |
| Water Depth (cm) | 30 | 100 | 10 | 20 | 25 | 45 | 35 |
| Water Turbidity (cm) | 30 | 30 | 30 | 20 | 20 | ||
| Conditions, 13:30 CDT | |||||||
| Water Depth (cm) | 15 | 85 | 2 | 10 | 15 | 35 | 30 |
| Water Turbidity (cm) | 30 | 30 | 20 | 15 | |||
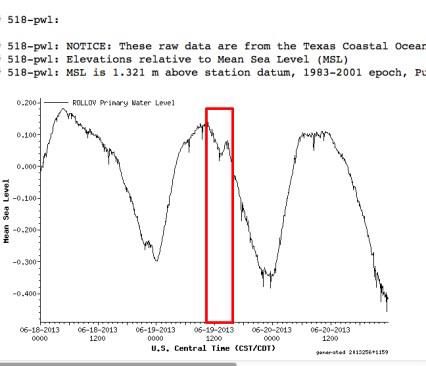 Figure 3. Tide data collected at Buoy 518 in Rollover Pass [http://lighthouse.tamucc.edu/pq]. The red box marks timeframe for data collection. Changing water levels and generally shallow water profiles created some complications for data processing. Data obtained from the Conrad Blucher Institute for Surveying and Science, Texas A&M UniversityCorpus Christi. Ancillary Data Collection. Data from the International Space Station was collected within 10 days of the field work, including two scenes of hyperspectral data from the Hyperspectral Imager for the Coastal Oceans (HICO) instrument (29 June and 28 August, 2013), and a sequence of astronaut photography of Galveston and Bolivar using the Nikon D3S and a 400 mm lens collected on June 21 at 19:42 UTC (ISS036-E-10423 through 10426 and ISS036-E10439 through 10441). See Figs. 6 and 7. While we have performed cursory review of these data for accuracy of location and overall quality, detailed processing and analysis of the data has not yet begun.
Data processing
The LiDAR and airborne hyperspectral data were processed at the University of Houston NCALM facility using the real time flight path data, and applying atmospheric correction algorithms to the data. Tidal measurements and field data were provided to help sort out sea level returns in the LiDAR data by the NCALM staff. To date, the cleaned LiDAR data has been used for first-order analysis, primarily to compare measured bottom morphology obtained from the bathymetric LiDAR (channel location and form, presence and extent of known Hurricane Ike storm deposits) with previous field mapping data and aerial photography.
Results
Our small project achieved the primary objective of coordinating and collecting LiDAR and hyperspectral data over our study area in conjunction with field data. Although data processing did not occur until late August and September, the data collections appear to provide useful information for mapping storm deposits and providing a baseline for future measurements of this dynamic coastline. The first order analysis results also suggest that shallow bathymetry and bottom morphology can be obtained in components of the Galveston Bay estuary that are not typically well-mapped, e.g. bayous and creeks.
One lesson that our team learned was that the LiDAR data processing was especially difficult because water levels were variable (tides and winds). In addition, the shallow and turbid water yielded confusing data that were difficult to reduce due to the fact that bottom reflections and surface water reflections could not be resolved in some locations. Despite these complications, the data sets suggest promising applications for understanding coastal changes around Galveston Bay. Figures 4 and 5 highlight one small set of the data.
Future work includes fully processing and interpreting the LiDAR and airborne hyperspectral data with field and buoy data, creating a bathymetric baseline, cross referencing the data with data collected from the ISS, and integrating this approach into JSC’s Climate Adaptation Science Investigator Workgroup activities (that support JSC Center Operations’ forward planning). In addition, the data collection has been integrated into another proposal by another University of Houston collaborator, and we are also partners on a proposal submitted to BP (mitigation funds from the Deepwater Horizon settlement) to develop additional strategies for monitoring nearshore dynamics in the Gulf of Mexico.
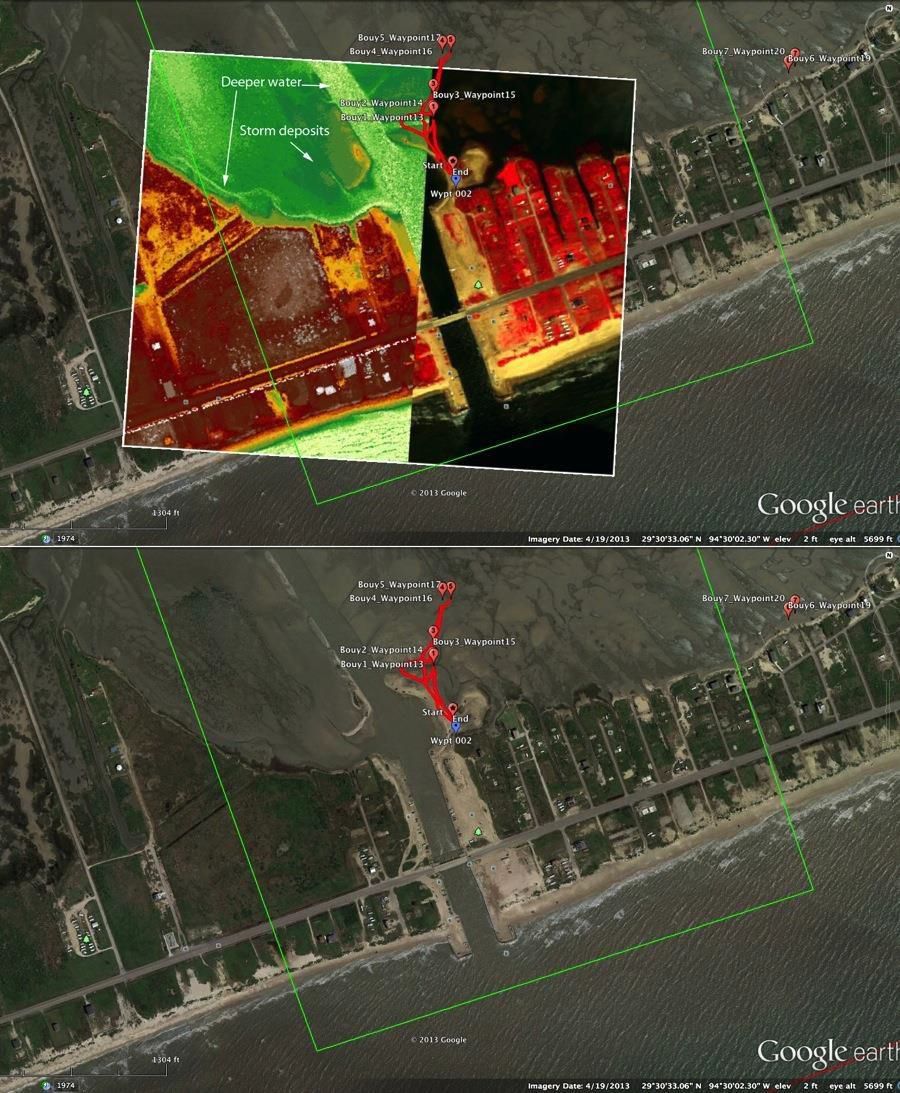
Figure 4 . Top: small portion of project data superimposed on Google Earth image of site. The red trace shows the bouys that were deployed. Left side of overlay ( red and green) is LiDAR, dark g reen represents shallower water, lighter green is deeper water. Right side of overlay (red and black) is a false - color slice of hyperspectral data. Bottom shows visible image of same area. The airborne data still require processing and analysis, but demonstrate the potential for useful information for bathymetric mapping in shallow, turbid water that is typical of Galveston Bay .
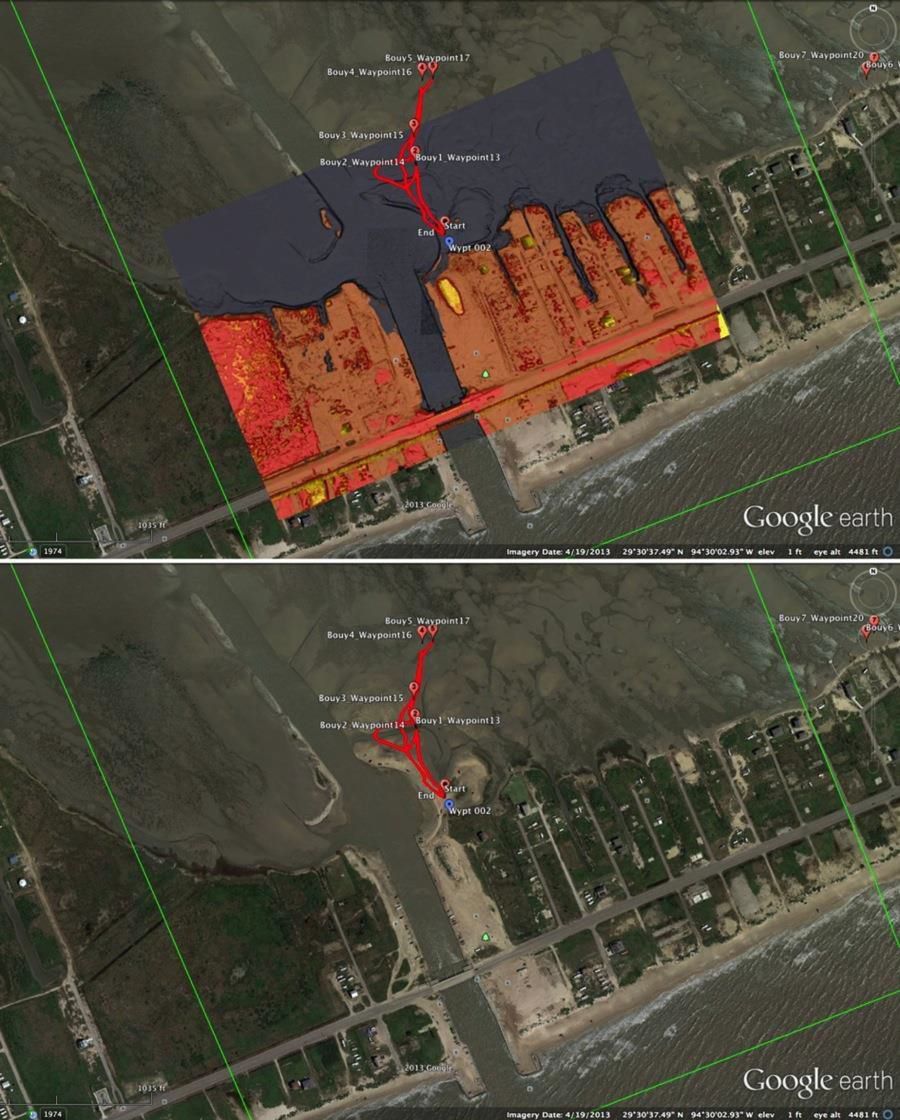
Figure 5 . Another roughly processed subset of our LiDAR data that is centered on the opening of Rollover Pass into the eastern part of Galveston Bay. Darker blue shading suggests offshore contours, although the data are not yet calibrated and require more processing to clearly define the water line . On land, yellow represents higher elevations. The image illustrates some of the data processing challenges distinguishing water ( surface and bottom reflections) but also suggest that useful bathymetric data – as well as useful topographic data on land – can be teased from the LiDAR data. The normal near - shore processes ( wind, waves and sediment transport) result in high rates of change along the coast; these data show promise for monitoring rates and geographic locations of sediment erosion and deposition.
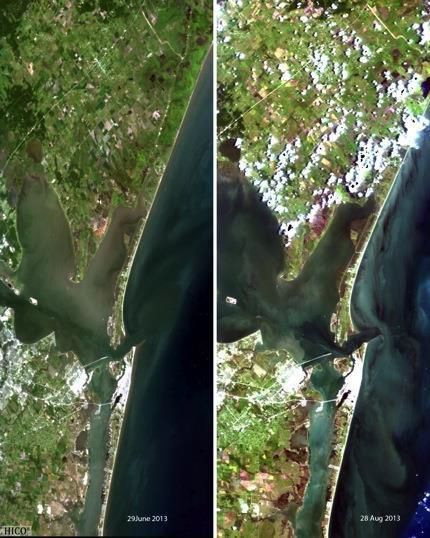
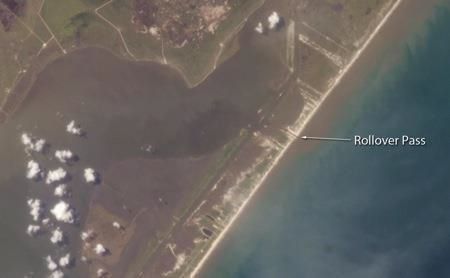
Figure 6 ( Left). False - color HICO data collected on June and August 2013. The data provide a regional hyperspectral data set.
Figure 7 ( Top ) . Rollover Pass from ISS. Temperature, wind and tides were similar to conditions during 19 June data collections. Image ISS036-E-10424, using a Nikon D3S with 400 mm lens, 21 June 2013 at 19:42 UTC.
References
Anderson, John B. , 2007. The Form ation and Future of the Upper Texas Coast. Texas A&M University Press, College Station, 163pp.
Doran, K.S., N.G. Plant, H.F. Stockdon, A.H. Sallenger, K.A. Serafin, 2009. Huuricane I k e: Observations and Analysis of Coastal C h ange. USGS Open - File Report 2009 - 1061 , US Department of the Interior, 35p.
Evans, C.A.; Wilkinson, M.J. ; and Eppler, D.E., 2011 . Hurricane Ike Deposits on the Bolivar Peninsula, Galveston Bay, Texas, Am. Geophys. Union 2011 Fall Meeting
Fernandez - Diaz, J.C.; Glennie, C.L.; Carter, W.E.; Shrestha, R.L.; Sartori, M.P.; Singhania, A.; Legleiter, C.J.; and Overstreet, B.T., 2014. Early Results of Simulataneous Terrain and Shallow Water Bathymetry Mapping Using a Single - Wavelength Airborne LiDAR Sensor . IEEE Journal of Selected Topics i n Applied Earth Observations and Remote Sensing, V. 7, No. 2, p. 623 - 635.
Kraus, N.C, and Lin, L., 2009, Hurricane Ike along the Upper Texas Coast: An Introduction. Shore & Beach, V.77, No. 2, p. 3 - 8.
Morton, R.A., 1975. Shoreline Changes Between Sabine Pass and Bolivar Roads, Circular 75 - 6 , Bureau of Economic Geology, University of Texas at Austin.
National Weather Service (NWS) Houston/Galveston 2008. Hurricane Ike (September 2008) Storm Surge Estimates from Damage Surveys (updated 18 October 2008). http://www.srh.noaa.gov/hgx/projects/ike08/storm_surge_overview.htm
Texas General Land Office 2008a. Erosion maps. http://www.glo.state.tx.us/coastal/erosion/erosionrates.html
Watson, R.L., 1999. Severe Beach Erosion Caused by Permanent Sand Loss Through Rollover Fish Pass, Bolivar Peninsula, Texas. Unpublished report for J. Martin Green and Alan McNeill, Attorneys at Law, 60 pp. http://www.texascoastgeology.com/papers/rollover.pdf
Watson, R.L., 2009. Evaluation of coastal response to Hurricane Ike through pre-storm and poststorm aerial photography, Shore & Beach, V.77, No. 2, p. 49-59.