ISS013-E-17394
| NASA Photo ID | ISS013-E-17394 |
| Focal Length | 400mm |
| Date taken | 2006.05.10 |
| Time taken | 19:35:13 GMT |
1000 x 690 pixels 540 x 373 pixels 540 x 711 pixels 1520 x 1008 pixels 639 x 435 pixels

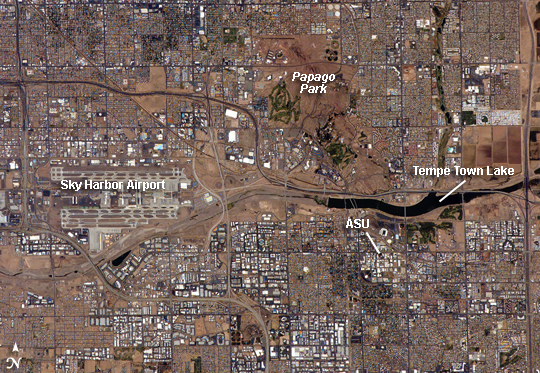
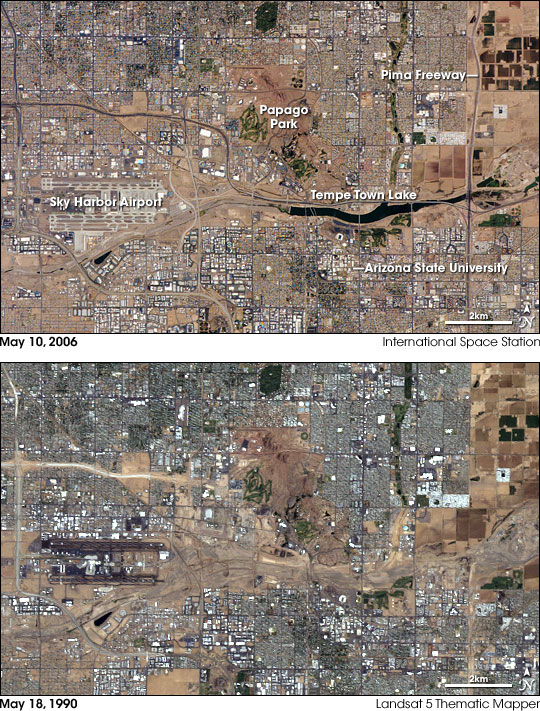
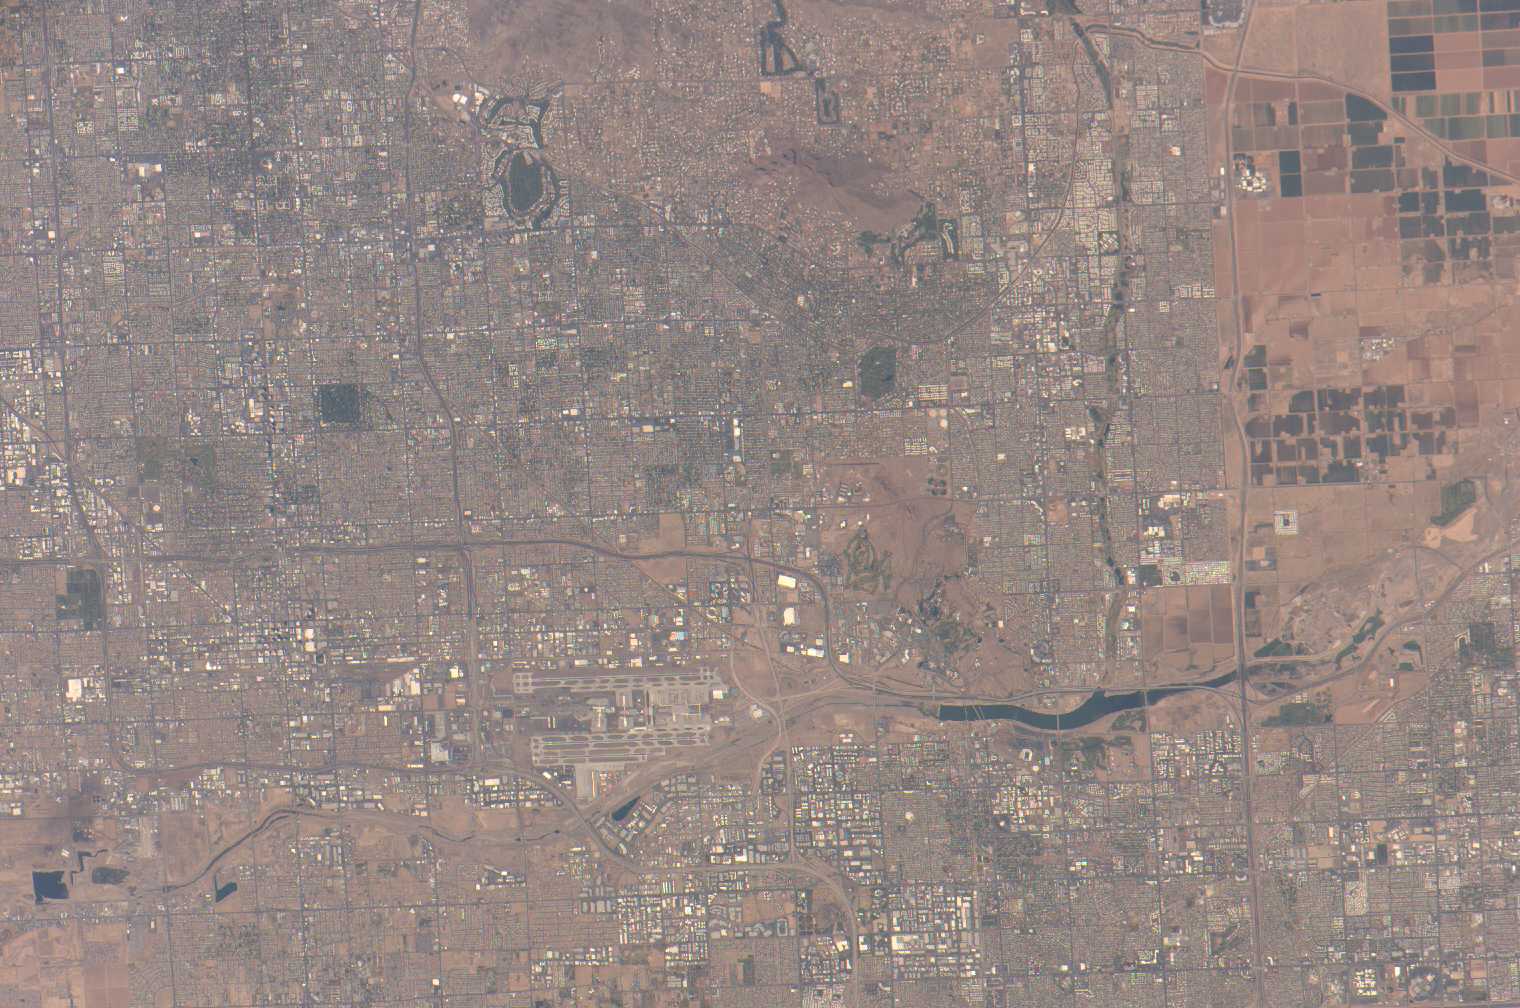
Photo center point: 33.5° N, 111.9° W
Photo center point by machine learning:
Country or Geographic Name: | USA-ARIZONA |
Features: | PHOENIX, SALT RIVER, TEMPE |
| Features Found Using Machine Learning: | |
Cloud Cover Percentage: | 10 (1-10)% |
Sun Elevation Angle: | 74° |
Sun Azimuth: | 192° |
Camera: | Kodak DCS760c Electronic Still Camera |
Focal Length: | 400mm |
Camera Tilt: | 13 degrees |
Format: | 3060E: 3060 x 2036 pixel CCD, RGBG array |
Film Exposure: | |
| Additional Information | |
| Width | Height | Annotated | Cropped | Purpose | Links |
|---|---|---|---|---|---|
| 1000 pixels | 690 pixels | No | Yes | Earth From Space collection | Download Image |
| 540 pixels | 373 pixels | Yes | Yes | Earth From Space collection | Download Image |
| 540 pixels | 711 pixels | Yes | Yes | NASA's Earth Observatory web site | Download Image |
| 1520 pixels | 1008 pixels | No | No | Not enhanced | Download Image |
| 639 pixels | 435 pixels | No | No | Download Image |
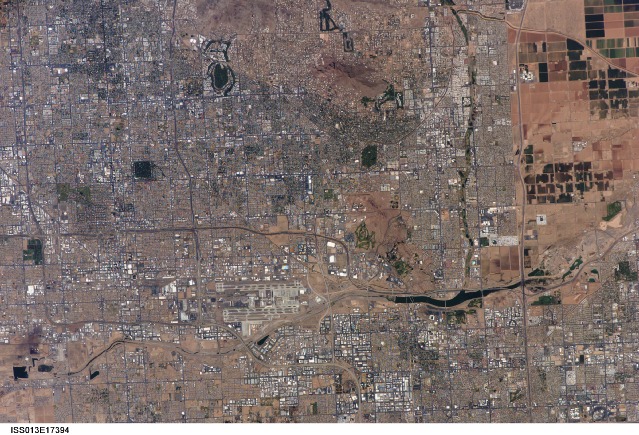
The Phoenix, Arizona, metropolitan area is the largest in the southwestern United States. The city is made up of 21 contiguous (connected through an unbroken sequence) incorporated municipalities. When discrete political entities form a larger, integrated urban landscape, geographers call the arrangement a conurbation. This astronaut photograph (upper image) of the central metro region includes the boundary area between three of the municipalities included in the conurbation: the cities of Phoenix (left), Tempe (center and lower right), and Scottsdale (upper right). This high-resolution astronaut image has a spatial resolution (level of detail) of about 9 meters per image pixel. A regional view of the greater Phoenix metropolitan area is also available from the Earth Observatory.
The urban area is still expanding along its fringes, but significant redevelopment is also ongoing in "landlocked" municipalities in the center of the metro area, where expansion is not possible (such as Tempe). Residential areas are grey and gridded into blocks, commercial or industrial sectors often have highly reflective white rooftops, desert soils and rock exposures are brown, vegetation is dark green, and water is black. Comparison of the astronaut image with Landsat Thematic Mapper data (lower image) acquired in 1990 reveals changes in the region over 16 years.
Perhaps the most striking change visible in this image pair is the appearance of Tempe Town Lake, filled in 1999 (upper image, right). The lake was created in the usually dry Salt River channel (dry because the river has been impounded upstream behind Roosevelt Dam since 1911). The lake is part of a plan to develop the Tempe portion of the channel and adjacent floodplain. Contained by inflatable dams to accommodate releases from Roosevelt Dam, the lake holds a nominal water volume of approximately 1 billion gallons, with an estimated 620 million gallons lost to evaporation each year. Other visible changes between 1990 and 2006 include development of land surrounding Sky Harbor Airport, expansion of the airport itself (a third runway, begun in 1997, is visible in the astronaut photograph), and completion of major highways to the southwest of Papago Park and to the east of Tempe Town Lake (upper image, right boundary). Study of the effects of urban modifications in the Phoenix metro area and the surrounding Sonoran Desert ecosystem is the focus of the Central Arizona-Phoenix Long Term Ecological Research site based at Arizona State University.
While suburbs and skyscrapers are the latest expression of civilization in this portion of the Sonoran Desert, it is not the first large-scale modification of the area to serve human needs. The Hohokam society cultivated the region and created an extensive network of irrigation canals between AD 300 and 1450. The canals remained long after the Hohokam themselves quit the region, and settlers used them in the 19th century to irrigate their fields with water from the Salt River.