ISS002-707-87
| NASA Photo ID | ISS002-707-87 |
| Focal Length | 110mm |
| Date taken | 2001.__.__ |
| Time taken | GMT |
Resolutions offered for this image:
1000 x 980 pixels 540 x 524 pixels 267 x 280 pixels 1031 x 1024 pixels 2063 x 2048 pixels 4127 x 4096 pixels 515 x 512 pixels
1000 x 980 pixels 540 x 524 pixels 267 x 280 pixels 1031 x 1024 pixels 2063 x 2048 pixels 4127 x 4096 pixels 515 x 512 pixels

Cloud masks available for this image:
Spacecraft nadir point:
Photo center point: 41.5° N, 112.5° W
Photo center point by machine learning:
Photo center point: 41.5° N, 112.5° W
Photo center point by machine learning:
Nadir to Photo Center:
Spacecraft Altitude: nautical miles (0km)
Country or Geographic Name: | USA-UTAH |
Features: | GREAT SALT LAKE AREA |
| Features Found Using Machine Learning: | |
Cloud Cover Percentage: | 25 (11-25)% |
Sun Elevation Angle: | ° |
Sun Azimuth: | ° |
Camera: | Hasselblad |
Focal Length: | 110mm |
Camera Tilt: | |
Format: | 5069: Kodak Elite 100S, E6 Reversal, Replaces Lumiere, Warmer in tone vs. Lumiere |
Film Exposure: | |
| Additional Information | |
| Width | Height | Annotated | Cropped | Purpose | Links |
|---|---|---|---|---|---|
| 1000 pixels | 980 pixels | Yes | Earth From Space collection | Download Image | |
| 540 pixels | 524 pixels | Yes | Earth From Space collection | Download Image | |
| 267 pixels | 280 pixels | Yes | Yes | NASA's Earth Observatory web site | Download Image |
| 1031 pixels | 1024 pixels | No | No | Download Image | |
| 2063 pixels | 2048 pixels | No | No | Download Image | |
| 4127 pixels | 4096 pixels | No | No | Download Image | |
| 515 pixels | 512 pixels | No | No | Download Image |
Download Packaged File
Download a Google Earth KML for this Image
View photo footprint information
Download a GeoTIFF for this photo
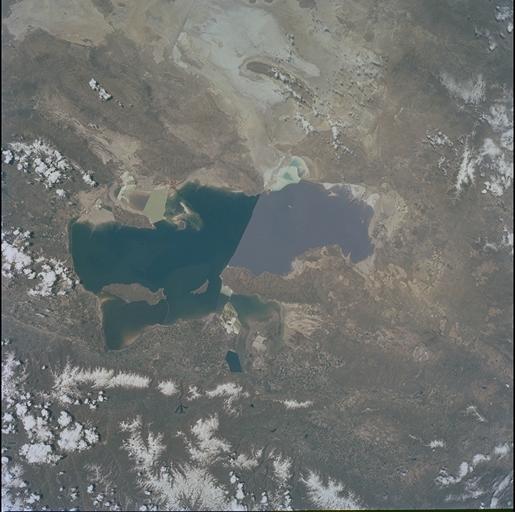
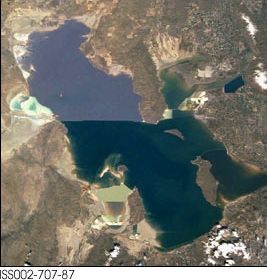
Image Caption: Effect of Drought on Great Salt Lake:
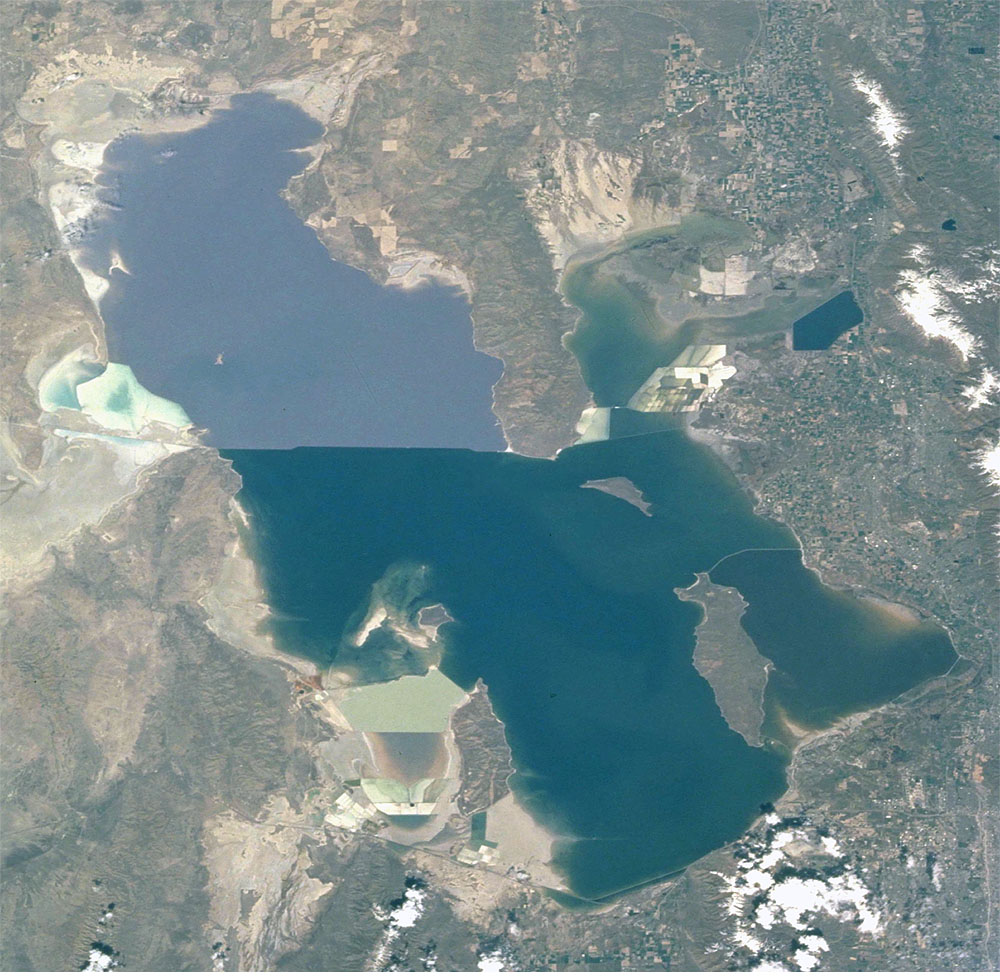
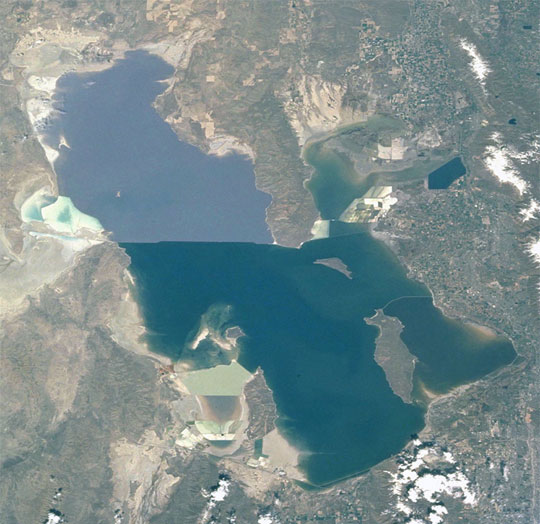
Great Salt Lake serves as a striking visual marker for astronauts orbiting over North America. A sharp line across its center is caused by the restriction in water flow from the railroad causeway. The eye-catching colors of the lake stem from the fact that Great Salt Lake is hypersaline, typically 3-5 times saltier than the ocean, and the high salinities support sets of plants and animals that affect the light-absorbing qualities of the water. North of the causeway salinities are higher, and the water turns red from the pigments of halophilic bacteria. In the shallower corners of the lake, earthen dikes mark large salt evaporation works, which take on the jewel tones of turquoise, russet, amber, and pearl white.
The detailed image (ISS005-E-16729) shows some of the salt works operated by Great Salt Lake Minerals and Chemicals Corporation near West Warren, Utah, on the eastern shore of the lake. Evaporative salt harvesting at Great Salt Lake is an important source of minerals for industrial uses. The lake contains an estimated 5 billion tons of salt, with 2.5 million additional tons washing in each year. Extraction rates are slightly higher than the amount added to the lake each year. In addition to sodium chloride, the ponds near West Warren are used to extract potassium sulfate and magnesium chloride, which are used to make fertilizers.
Space Station astronauts have recorded the decline in lake levels in response to a regional 5-year drought taking both detailed views and broad views of the entire lake (ISS007-E-13002 and this image). As lake levels have declined the salt works have become islands in the middle of a dry lakebed. Seasonal fluctuations in Great Salt Lake produce annual lows every fall, but there are significant longer-term fluctuations in lake levels relating to the climate. Great Salt Lake hit a 22-year low at 4,198 feet in the fall of 2002, and a near-record low again in October 2003. The lowest level ever recorded was 4,191 feet in 1963, and the highest levels were 4,212 feet in June 1986 and April 1987. Experimental scientific forecasts predict that lake levels will begin gradually increasing again, but the U.S. Seasonal Drought Outlook indicates only limited improvement from this snow season because the water deficits are so high.
Around the world, lake levels are an excellent indicator of local climate. Repeat observations over time allow comparisons and levels rise and fall in response to droughts and the broader climate patterns that are linked to droughts.
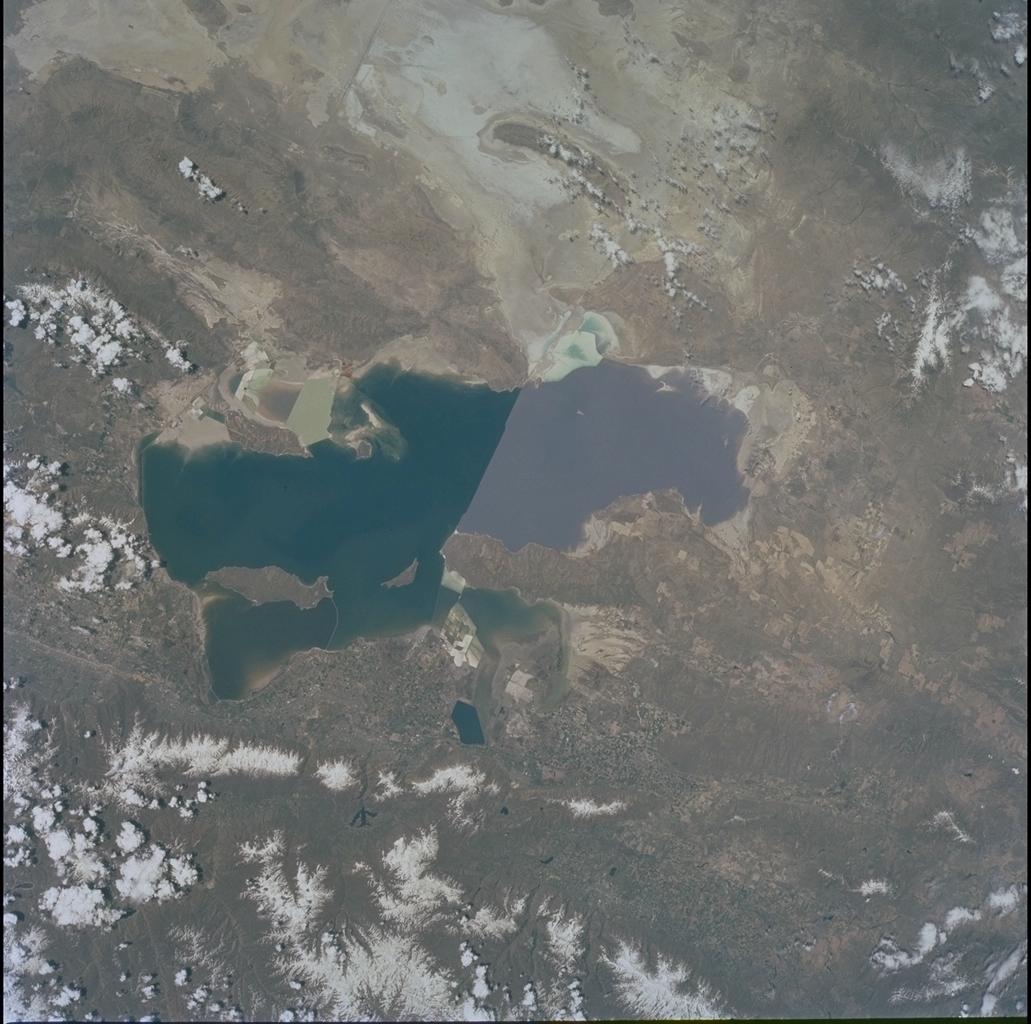
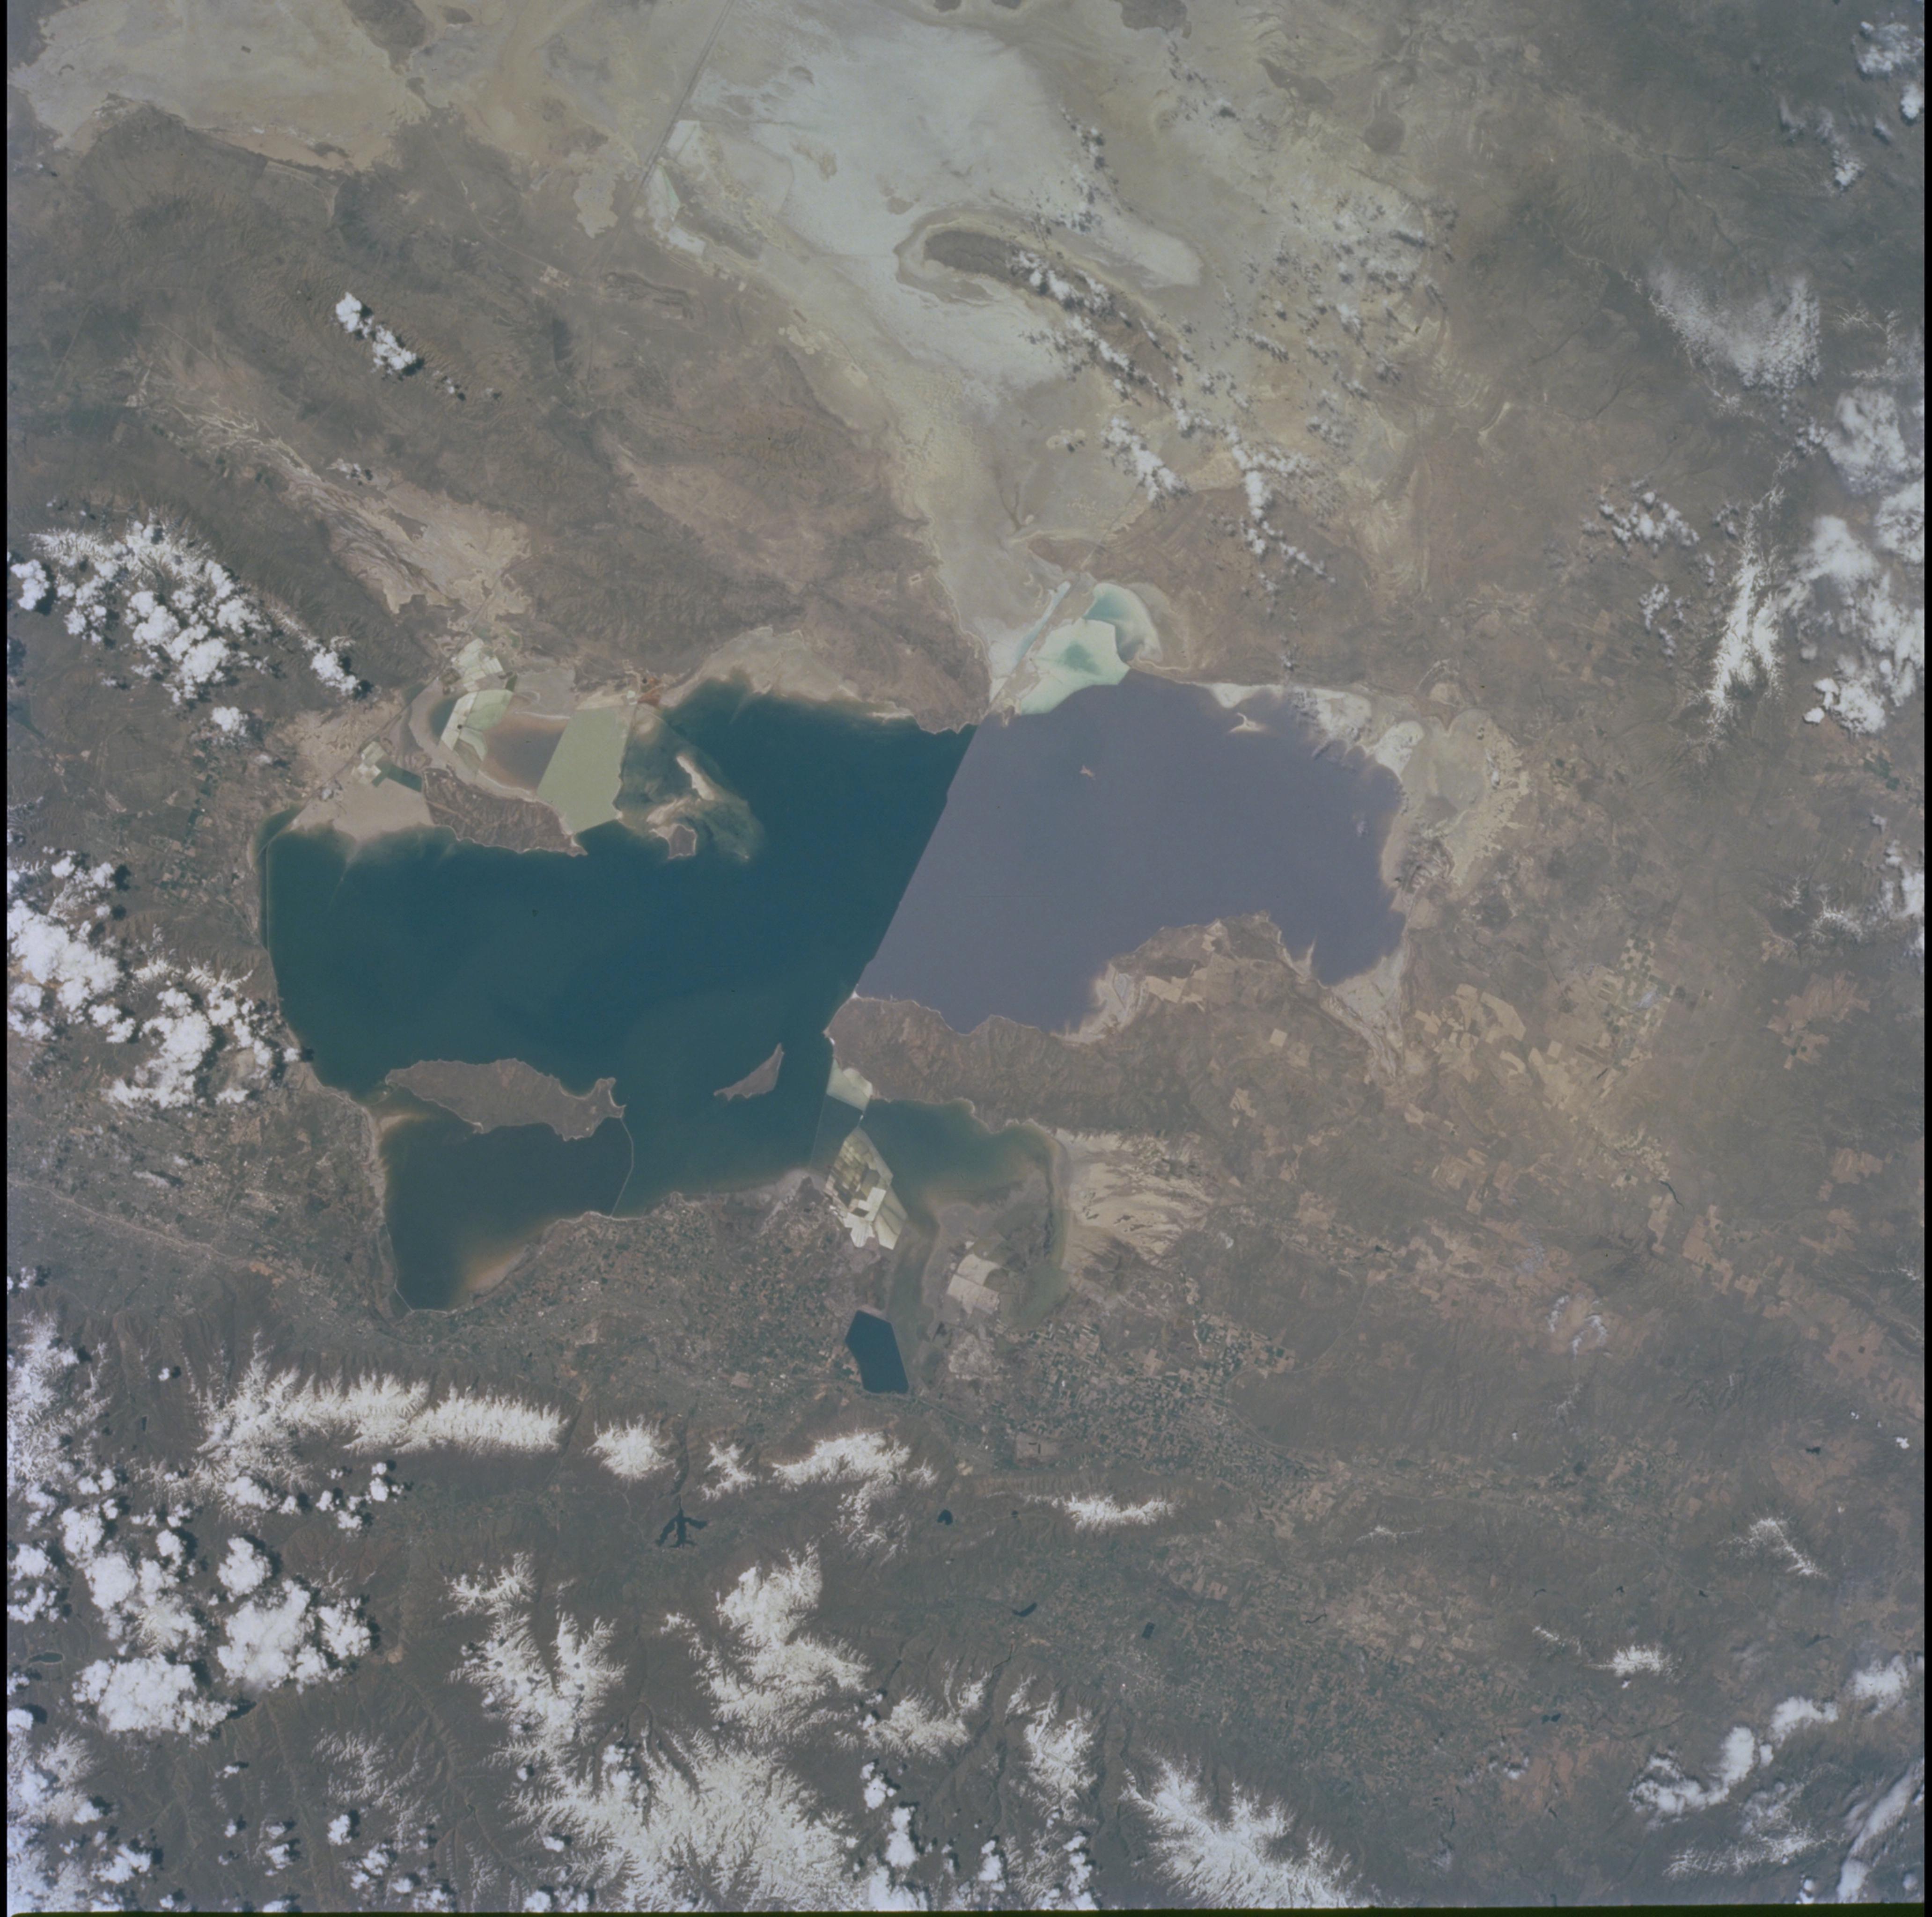